Blurred Data Generation (Natural Images) for NN Training
This example demonstrates how to generate blurred image data for training neural network models for deconvolution (deblurring). The original images are part of the BSDS500 dataset provided by the Berkeley Segmentation Dataset and Benchmark project.
[1]:
import numpy as np

from jax import vmap

from scico import plot
from scico.flax.examples import PaddedCircularConvolve, load_image_data
plot.config_notebook_plotting()
Define blur operator.
[2]:
output_size = 256  # patch size
channels = 1  # gray scale problem
blur_shape = (9, 9)  # shape of blur kernel
blur_sigma = 5  # Gaussian blur kernel parameter

opBlur = PaddedCircularConvolve(output_size, channels, blur_shape, blur_sigma)
opBlur_vmap = vmap(opBlur)  # for batch processing
Read data from cache or generate if not available.
[3]:
train_nimg = 400  # number of training images
test_nimg = 64  # number of testing images
nimg = train_nimg + test_nimg
gray = True  # use gray scale images
data_mode = "dcnv"  # deconvolution problem
noise_level = 0.005  # standard deviation of noise
noise_range = False  # use fixed noise level
stride = 100  # stride to sample multiple patches from each image
augment = True  # augment data via rotations and flips

train_ds, test_ds = load_image_data(
    train_nimg,
    test_nimg,
    output_size,
    gray,
    data_mode,
    verbose=True,
    noise_level=noise_level,
    noise_range=noise_range,
    transf=opBlur_vmap,
    stride=stride,
    augment=augment,
)
Data read from path       :   ~/.cache/scico/examples/data
Set --training--          :   Size:   3600
Set --testing --          :   Size:   192
Data range -- images --   :    Min:   0.00, Max: 0.84
Data range -- labels --   :    Min:   0.00, Max: 1.00
NOTE: If blur kernel or noise parameter are changed, the cache must be manually
      deleted to ensure that the training data is regenerated with the new
      parameters.
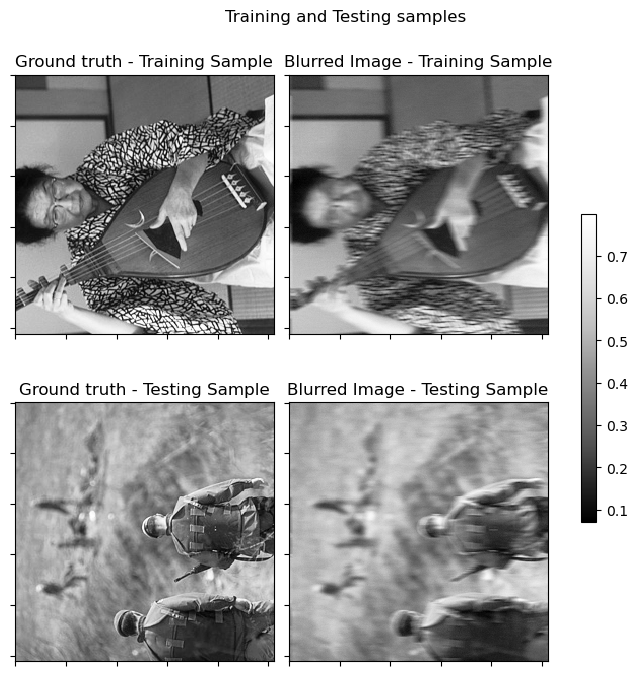
Plot randomly selected sample.
[4]:
indx_tr = np.random.randint(0, train_nimg)
indx_te = np.random.randint(0, test_nimg)
fig, axes = plot.subplots(nrows=2, ncols=2, figsize=(7, 7))
plot.imview(
    train_ds["label"][indx_tr, ..., 0],
    title="Ground truth - Training Sample",
    fig=fig,
    ax=axes[0, 0],
)
plot.imview(
    train_ds["image"][indx_tr, ..., 0],
    title="Blurred Image - Training Sample",
    fig=fig,
    ax=axes[0, 1],
)
plot.imview(
    test_ds["label"][indx_te, ..., 0],
    title="Ground truth - Testing Sample",
    fig=fig,
    ax=axes[1, 0],
)
plot.imview(
    test_ds["image"][indx_te, ..., 0],
    title="Blurred Image - Testing Sample",
    fig=fig,
    ax=axes[1, 1],
)
fig.suptitle(r"Training and Testing samples")
fig.tight_layout()
fig.colorbar(
    axes[0, 1].get_images()[0],
    ax=axes,
    shrink=0.5,
    pad=0.05,
)
fig.show()