Noisy Data Generation for NN Training
This example demonstrates how to generate noisy image data for training neural network models for denoising. The original images are part of the BSDS500 dataset provided by the Berkeley Segmentation Dataset and Benchmark project.
[1]:
import numpy as np

import komplot as kplt

from scico.flax.examples import load_image_data
kplt.config_notebook_plotting()
Read data from cache or generate if not available.
[2]:
size = 40  # patch size
train_nimg = 400  # number of training images
test_nimg = 64  # number of testing images
nimg = train_nimg + test_nimg
gray = True  # use gray scale images
data_mode = "dn"  # Denoising problem
noise_level = 0.1  # Standard deviation of noise
noise_range = False  # Use fixed noise level
stride = 23  # Stride to sample multiple patches from each image

train_ds, test_ds = load_image_data(
    train_nimg,
    test_nimg,
    size,
    gray,
    data_mode,
    verbose=True,
    noise_level=noise_level,
    noise_range=noise_range,
    stride=stride,
)
Data read from path: ~/.cache/scico/examples/data
Set --training-- size: 104000
Set --testing -- size: 16640
Data range -- images --  Min:  0.00  Max:  1.00
Data range -- labels --  Min:  0.00  Max:  1.00
NOTE: If blur kernel or noise parameter are changed, the cache must be manually
      deleted to ensure that the training data is regenerated with the new
      parameters.
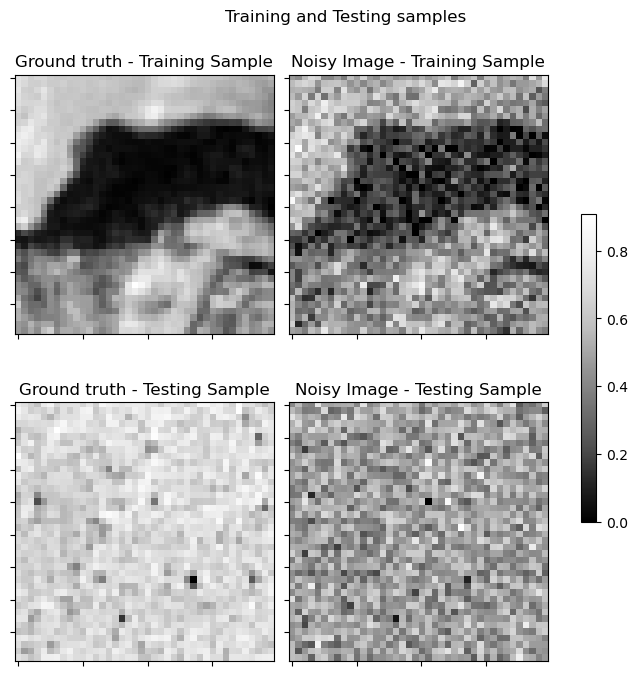
Plot randomly selected sample. Note that patches have small sizes, thus, plots may correspond to unidentifiable fragments.
[3]:
indx_tr = np.random.randint(0, train_nimg)
indx_te = np.random.randint(0, test_nimg)
fig, axes = kplt.subplots(nrows=2, ncols=2, figsize=(7, 7))
kplt.imview(
    train_ds["label"][indx_tr, ..., 0],
    title="Ground truth - Training Sample",
    ax=axes[0, 0],
)
kplt.imview(
    train_ds["image"][indx_tr, ..., 0],
    title="Noisy Image - Training Sample",
    ax=axes[0, 1],
)
kplt.imview(
    test_ds["label"][indx_te, ..., 0],
    title="Ground truth - Testing Sample",
    ax=axes[1, 0],
)
kplt.imview(test_ds["image"][indx_te, ..., 0], title="Noisy Image - Testing Sample", ax=axes[1, 1])
fig.suptitle(r"Training and Testing samples")
fig.tight_layout()
fig.colorbar(
    axes[0, 1].get_images()[0],
    ax=axes,
    shrink=0.5,
    pad=0.05,
)
fig.show()