X-ray Transform Comparison
This example compares SCICO’s native X-ray transform algorithm to that of the ASTRA toolbox.
[1]:
import numpy as np

import jax
import jax.numpy as jnp

from xdesign import Foam, discrete_phantom

import scico.linop.xray.astra as astra
from scico import plot
from scico.linop import Parallel2dProjector, XRayTransform
from scico.util import Timer
plot.config_notebook_plotting()
Create a ground truth image.
[2]:
N = 512

det_count = int(jnp.ceil(jnp.sqrt(2 * N**2)))

x_gt = discrete_phantom(Foam(size_range=[0.075, 0.0025], gap=1e-3, porosity=1), size=N)
x_gt = jnp.array(x_gt)
Time projector instantiation.
[3]:
num_angles = 500
angles = jnp.linspace(0, jnp.pi, num=num_angles, endpoint=False)

timer = Timer()

projectors = {}
timer.start("scico_init")
projectors["scico"] = XRayTransform(Parallel2dProjector((N, N), angles))
timer.stop("scico_init")

timer.start("astra_init")
projectors["astra"] = astra.XRayTransform2D(
    (N, N), det_count=det_count, det_spacing=1.0, angles=angles - jnp.pi / 2.0
)
timer.stop("astra_init")
Time first projector application, which might include JIT overhead.
[4]:
ys = {}
for name, H in projectors.items():
    timer_label = f"{name}_first_fwd"
    timer.start(timer_label)
    ys[name] = H @ x_gt
    jax.block_until_ready(ys[name])
    timer.stop(timer_label)
Compute average time for a projector application.
[5]:
num_repeats = 3
for name, H in projectors.items():
    timer_label = f"{name}_avg_fwd"
    timer.start(timer_label)
    for _ in range(num_repeats):
        ys[name] = H @ x_gt
        jax.block_until_ready(ys[name])
    timer.stop(timer_label)
    timer.td[timer_label] /= num_repeats
Time first back projection, which might include JIT overhead.
[6]:
y = np.zeros(H.output_shape, dtype=np.float32)
y[num_angles // 3, det_count // 2] = 1.0
y = jnp.array(y)

HTys = {}
for name, H in projectors.items():
    timer_label = f"{name}_first_back"
    timer.start(timer_label)
    HTys[name] = H.T @ y
    jax.block_until_ready(ys[name])
    timer.stop(timer_label)
Compute average time for back projection.
[7]:
num_repeats = 3
for name, H in projectors.items():
    timer_label = f"{name}_avg_back"
    timer.start(timer_label)
    for _ in range(num_repeats):
        HTys[name] = H.T @ y
        jax.block_until_ready(ys[name])
    timer.stop(timer_label)
    timer.td[timer_label] /= num_repeats
Display timing results.
On our server, when using the GPU, the SCICO projector (both forward and backward) is faster than ASTRA. When using the CPU, it is slower for forward projection and faster for back projection. The SCICO object initialization and first back projection are slow due to JIT overhead.
On our server, using the GPU:
init         astra    4.81e-02 s
init         scico    2.53e-01 s

first  fwd   astra    4.44e-02 s
first  fwd   scico    2.82e-02 s

first  back  astra    3.31e-02 s
first  back  scico    2.80e-01 s

avg    fwd   astra    4.76e-02 s
avg    fwd   scico    2.83e-02 s

avg    back  astra    3.96e-02 s
avg    back  scico    6.80e-04 s
Using the CPU:
init         astra    1.72e-02 s
init         scico    2.88e+00 s

first  fwd   astra    1.02e+00 s
first  fwd   scico    2.40e+00 s

first  back  astra    1.03e+00 s
first  back  scico    3.53e+00 s

avg    fwd   astra    1.03e+00 s
avg    fwd   scico    2.54e+00 s

avg    back  astra    1.01e+00 s
avg    back  scico    5.98e-01 s
[8]:
print(f"init         astra    {timer.td['astra_init']:.2e} s")
print(f"init         scico    {timer.td['scico_init']:.2e} s")
print("")
for tstr in ("first", "avg"):
    for dstr in ("fwd", "back"):
        for pstr in ("astra", "scico"):
            print(
                f"{tstr:5s}  {dstr:4s}  {pstr}    {timer.td[pstr + '_' + tstr + '_' + dstr]:.2e} s"
            )
        print()
init         astra    5.54e-02 s
init         scico    3.03e-01 s

first  fwd   astra    5.99e-02 s
first  fwd   scico    2.81e-02 s

first  back  astra    4.31e-02 s
first  back  scico    3.56e-01 s

avg    fwd   astra    4.68e-02 s
avg    fwd   scico    2.84e-02 s

avg    back  astra    3.81e-02 s
avg    back  scico    7.20e-04 s
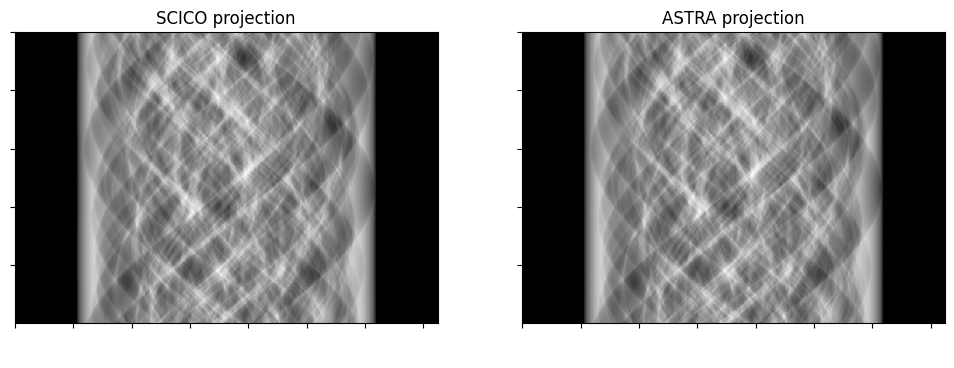
Show projections.
[9]:
fig, ax = plot.subplots(nrows=1, ncols=2, figsize=(12, 6))
plot.imview(ys["scico"], title="SCICO projection", cbar=None, fig=fig, ax=ax[0])
plot.imview(ys["astra"], title="ASTRA projection", cbar=None, fig=fig, ax=ax[1])
fig.show()
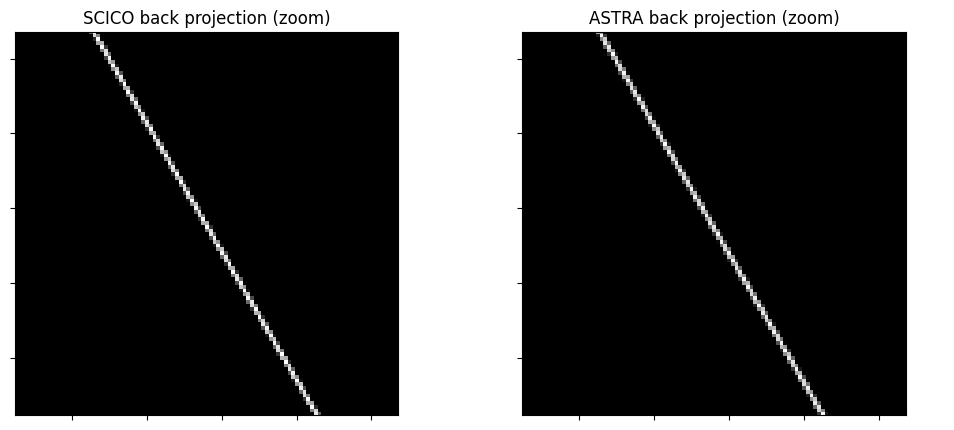
Show back projections of a single detector element, i.e., a line.
[10]:
fig, ax = plot.subplots(nrows=1, ncols=2, figsize=(12, 6))
plot.imview(HTys["scico"], title="SCICO back projection (zoom)", cbar=None, fig=fig, ax=ax[0])
plot.imview(HTys["astra"], title="ASTRA back projection (zoom)", cbar=None, fig=fig, ax=ax[1])
for ax_i in ax:
    ax_i.set_xlim(2 * N / 5, N - 2 * N / 5)
    ax_i.set_ylim(2 * N / 5, N - 2 * N / 5)
fig.show()